House prices are always in the news. Whether there is a property market crash, a downturn in the economy or a debate about housing stock; average house prices are often used as a barometer of the current state of the economy - even if this can be misleading!
For businesses looking to market products to a defined audience or target sales activity to the most profitable areas, house prices can play an important part in refining that strategy.
Houses are the largest component of wealth for the majority of households in the United Kingdom.
And it goes without saying that, in general, the larger and more expensive the property, the higher the household income required to make the mortgage or rental payments.
Of course care should be taken to equate house price to disposable income. The income of many households is now stretched and a higher percentage of income than ever before is being used to fund the mortgage or rental payments on property.
Of course, there are huge price fluctuations across the country and the average price of a similar type of house in different parts of the country can vary wildly.
As we all know, detached properties are more expensive than terraced and properties in the North of England are more expensive than the South East.
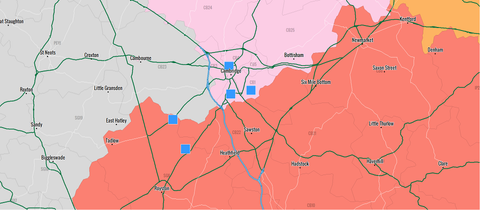
As an example, according to the Land Registry data for Q2 2016, a detached house near Preston in Lancashire will, on average, cost around £270,000. Purchase a similar detached house near Harpenden in Hertfordshire and it will set you back in excess of £1 million!
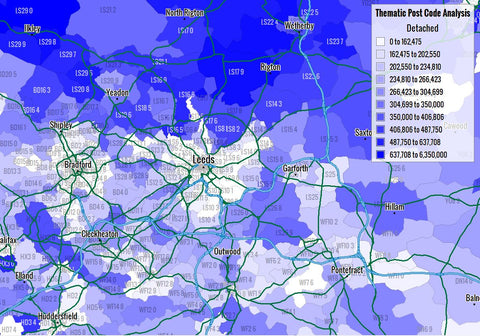
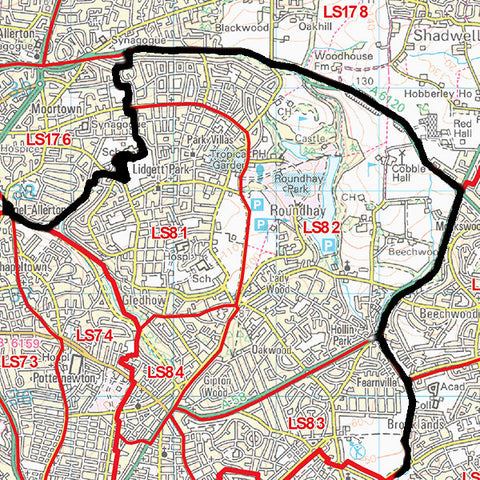
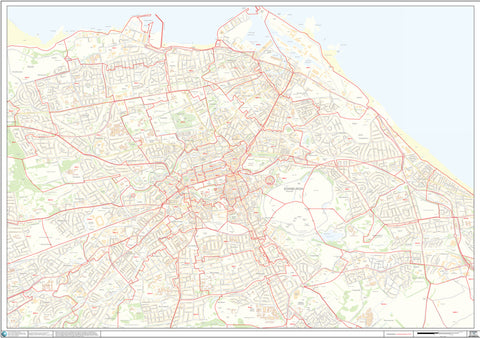
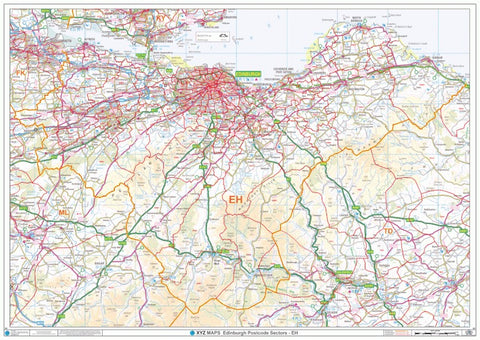
But variations in prices are not just national or regional in nature.
The image above shows Postcode Sectors shaded by the average prices for detached properties for 2016 Q2 - the darker the blue, the higher the average price as indicated in the key, top right of the image.
Detached prices in the dark blue areas north of Leeds indicate averages up to £650,000+ whereas the areas to the South of Leeds are much lighter indicating typical prices much lower at around the £200 - £350k range.
Such differences can affect decisions such as where to promote high value luxury goods.
Understanding the local property markets can also help identify the demand for specific products and services.
For example, areas with high volumes of property transactions are more likely to have households looking for high value products such as white goods, furniture and carpets with which to furnish their new homes.
Equally, areas which have seen dramatic price increases in house value are likely to have homeowners more inclined to free up equity to purchase a new conservatory or extension.
In analysing the average house prices for Q2 2016, we thought it would be fun to see which Postcode Districts topped the charts!
These figures only reflect sales made in Q2 2016 where at least one transaction took place.
Type |
Postcode District |
Average Price (£) |
Detached |
SW13 |
£5,000,000 |
Semi-Detached | NW1 | £11,500,000 |
Terraced | WC1N | £6,750,000 |
Flat | W1G | £3,815,000 |
Overall Average | W1G | £3,815,000 |
Type |
Postcode District |
Average Price (£) |
Detached |
CF40 |
£75,667 |
Semi-Detached | LL71 | £45,000 |
Terraced | TS2 | £30,000 |
Flat | BB6 | £19,000 |
Overall Average | TS2 | £30,000 |
If you are a business interested in licensing the average house price data for England and Wales, you can find out more information on our Average House Price by Postcode product page.
]]>Sales staff come and go: retirement, relocation or just career progression. So designing territories based on where your sales people live is not a great idea for long term sales force efficiency. Territories will need to be taken over by future staff who could live anywhere within the area.
So sales territories need to be created around the long-term needs of your business such as servicing existing customers - or acquiring new ones - as quickly and as profitably as possible.
Of course, there are always exceptions to the rule. Important clients may come with established relationships with their preferred sales staff —so much so that they won’t work with anyone else! In these situations, you may need to assign the preferred sales person to that account to ensure the customer is made to feel valued and their business retained.
When creating sales territories for the first time, it’s usually best to start in areas where options are limited like the corners of the map. In the UK, good places to create your first territories are Cornwall, Kent, South West Wales or Northern Scotland and then work your way inland.
When you reach the interior of the country, you will have much more flexibility to reallocate Districts or Sectors and achieve the optimum balance of workload or sales potential across your territory structure.
This approach will save countless hours of work, create the most equitable and balanced territories and ensure that each territory will have sufficient revenue potential to be viable.
Understanding natural and man-made geography is extremely important when creating sales territories. Can you expect sales staff to reach their daily call quota if they need to cross the Highlands just to reach half their client list? Or worse, what if they need to cross the Irish Sea just to see some key accounts?
This is why local geography always needs to be taken into consideration. Failing to do so will result in wasted sales time and frustrated staff, which inevitably leads to lower sales revenue and higher staff turnover.
In the example below, you can see an poorly crafted sales territory. The sales person in territory 11 (red) has to cover Devon but also drive up to cross the Severn Bridge to reach the accounts in Cardiff.
To optimize this sales territory, you would need to re‐allocate Cardiff accounts to the green and blue territories so that the sales person no longer has to cross the bridge to reach Wales.
At first thought, it may seem logical to use major roads and motorways as territory borders as you can only cross them at motorway junctions or via bridges. However, motorways in particular are high speed routes to the extremities of territories – plus the safest roads to drive on!
Using motorways as arteries allows sales people to reach their accounts faster and more efficiently resulting in more time in front of clients and less time in the car.
This is illustrated in the example below. Here, you see two territories, 6 (green) and 22 (purple). Both sales staff have to use the M40 to reach their respective accounts in Bicester and, as a consequence, pass through each other’s territories on the way.
This is not an efficient use of time and effort. Ideally, we should re‐allocate all the Bicester accounts to just one of the two territories and shift the territory boundary so that just one sales person has access to that section of the M40.
One of the most inefficient territory characteristics is when a sales rep needs to cross someone else’s territory to reach a client! They will literally be driving by someone else’s accounts to reach their own which is clearly a drain on time and resources.
It is not uncommon for sales people to request accounts in other territories because they may be located near their children’s schools or near family. Because they frequent the area all the time they will assume it’s only logical for them to have these accounts.
Although this approach may make sense, you cannot take liberties like this for your sales staff. They will create long‐lasting business relationships and, at some point, they will leave the organization forcing a replacement to take over anyway.
It is therefore always best to ensure all territories are contiguous.
This is illustrated in the example below:
Here, the sales person in the red territory has to cross several Postcode Districts owned by the blue territory to reach the small cluster of red by Dartmouth.
This is clearly not ideal and eliminating these non‐contiguous clusters will help optimize your sales territory structure.
For more information on how to build the optimum sales territory structure, call us today on 0844 808 2495 or download a free 2 week trial of AlignMix and have a play designing your own territories!
]]>With the launch of AlignMix in the UK, we look at five common mapping software features franchise and territory managers most often ask for.
Creating territories or franchise areas from Postcode geography can be done in many different software mapping systems. But the process of grouping Postcodes to create territories differs in each system and can often be overly technical and time-consuming unless you are an expert user.
Feedback from our customers indicated that creating territories should be as easy as using a simple paint program - just paint the areas on the map that you want to be included in each territory.
AlignMix's patent pending Touch Align technology allows you to create an unlimited number of territories with literally a single click of your mouse! Simply click and move your mouse over the map and the underlying Postcode Districts are added to your territories as if you were painting them.
Of course there are several other tools to create sales territories: the lasso tool selects a group of Postcode Districts to add to a new territory and the Circle tool selects all the Postcode Districts within your chosen radius of a given location.
When creating territories, you will usually want to ensure each sales person or franchise has an equal sales potential or workload if they are serving existing customers. One of the unavoidable task of territory management is reworking territory structures due to staff changes, changes in market demand or through expansion.
AlignMix allows you to monitors a territory value when making these changes and show you the effects of any changes instantly on the map.
You may want to monitor:
Whatever you choose, you can see the impact territory changes have on the value in real time as you work. No need to run calculations after each change or refer to a separate spread sheet, AlignMix makes balancing territories effortless.
All software allows the colours of territories to be changed and some allow you to create your own colour sequences to save and use for future territories.
AlignMix is actually supplied with a number of prepared colour schemes that you can apply to your territories at the click of a button.
And if a standard colour scheme isn't quite what you are looking for you can use simply change the colour of any individual territory with a couple of clicks and select any colour you want.
Once territories or franchise areas have been created, the next obvious step is to tell the appropriate staff or franchise owners what their area is and what it contains.
Again, all this is possible in most types of mapping software but it many systems it can be a long, painful and frustrating process. You may have to undertake a number of steps to get what you want and a typical process might look like this:
Depending on the number of territories you have this can almost be a job in its own right!
AlignMix Professional comes with the ability to produce territory spread sheets containing all the above information for every territory you have in an automated 'batch' process. Just leave it to run and send out the spreadsheets when the process is finished freeing up your time to do more important tasks.
Download an example Territory Spread Sheet by clicking the Excel logo below.
When planning and designing sales territories or franchise areas, it helps to know where your potential market is located.
Sometimes importing demographic or sales data, defining your data ranges and setting the colour ranges can be quite a long winded process.
Again, AlignMix Professional attempts to make this as simple and as intuitive so you have more time for planning the business rather than making the maps!
With a few clicks you can visualise your sales potential or existing demand to help with the designing of your sales territories or franchise areas.
You can also add your territory boundaries and names quickly and easily to the map and see where market concentrations are within your territories.
Read more about the features of AlignMix and read our customer testimonials here >
Download your FREE copy of AlignMix Standard and start mapping your territories today!
]]>The relationship between Postcodes and Constituency information is vital for many businesses in building relationships with local communities based on their organisations political footprint.
Identifying the constituencies that employees, suppliers and customers reside in is essential for targeting localised public relations activity and communication efforts to the key geographic areas for your business..
It is of course possible to look up Postcodes one by one and record the constituency, MP and political party for that Postcode. However, if you have hundreds or even thousands of Postcodes, manually collecting the information is clearly not practical.
However, if you use Microsoft Excel there is a way of doing all the work automatically at the push of a button! Watch a video overview here:
We maintain a database of over 2.5 million Postcodes (including retired Postcodes) and the Parliamentary Constituency information related to each one.
As Postcode and constituency data changes on a continual basis, we update all information every 3 months to ensure the spread sheet is as up to date as possible.
To use this unique tool, we simply supply you with an Excel spread sheet and Access database for you to copy to a folder on your PC - no installation or technical knowledge is required (Note: you do not need to know how to use Access!).
All you need is a current version of Microsoft Office and the ability to run macro's in Excel. It’s as simple as that!
To get started, simply open the supplied spread sheet as shown below:
To start matching follow these simple steps.
You can download the full User Guide for this Excel Spread Sheet here >
Tests to date have shown that the spread sheet will match up to 1,000 Postcodes per minute. So for a handful of Postcodes matching is almost instant. If you need to run a large batch process then it may take a few minutes and it may be a good time to make a cup of tea!
We update the Postcode database on a quarterly basis to take into account Postcode changes from Royal Mail and also changes to Constituency data as result of by-elections and other events.
The spread sheet and supporting data is available for an annual licence fee of £595 plus VAT which includes all updates released during the year and unlimited support.
The spread sheet can be ordered for immediate download directly from our Postcode to Constituency Excel Matching Spread Sheet page here >
For more information on this Automated Excel Matching Spread Sheet, please use the contact form or call 0844 808 2495.
]]>Map Logic Postcode maps are perfect franchise territory planning aids and provide the essential features required by successful franchise organisations:
You can see which of our ready-made maps cover your franchise area by entering your town in the box below and clicking Go:
Because all franchise businesses are different, we also offer a highly flexible customised map service to create the perfect map for your franchise. Used by banks, charities, automotive dealerships, gyms and even weight loss franchises, these maps offer:
You can have a look at our custom map options online! Simply enter your town name in one of the search boxes below to get started:
Not sure which option is right for you? Just let us know what you need and we will come back with the best options for you to consider.
]]>As a result you generally have to either 'make do' with a map that covers a larger area than you actually require or you have to purchase 2 or more maps to cover the entire area you need. Neither option is ideal.
However, as a result of advances in online systems and printing technology, we can offer completely personalised maps at affordable prices. This guide shows you how to produce a map of exactly the area you want using our Maps Maker system and put your name on it!
Once you know the type of map you want - for example a Postcode map - you can select this from the menu at the top of the Maps Maker page:
Alternatively, if you want to see all available options for your location, simply type a place name in the search box on the home page:
and click Search to see a list of maps for that area as shown below for Oxford:
Once you have selected the map you want, you will be presented with a screen similar to the one below:
If you haven't already set a location, you can enter a place name or UK Postcode in the search box and click the 'Go' button to pick from a list of locations to centre your map on.
This screen also allows you to customise your map by using the tools to the right of the preview image as described below. Please note that as you make changes to the map, the preview image will regenerate to reflect these changes. This may take a few seconds for each change so please be patient.
When clicking the 'Adjust Map Area' button you will be presented with a screen similar to that shown below:
The highlighted area shows the current area that will be displayed on your map. You can change the size of the area by clicking on the circular handle on the bottom right hand corner of the highlighted area and dragging it to enlarge or reduce the area.
If you need to see a larger area than is currently viewable on screen, you can use the plus and minus symbols in the top left hand corner of the map to zoom in and out to get the exact area you need.
Note you can also change the orientation of the map on this page by selecting portrait or landscape in the bottom left hand corner of the screen.
Once you are happy that the highlighted area matches the area you want to see on your map you can click the 'Apply' button to the bottom right to apply the changes and return to the preview screen.
On the 'Customising Your Map' screen, the preview map image is shown as below:
This is obviously quite small and you will generally want a closer look at the map to ensure it covers the area you want and shows the expected level of detail.
To do this simply click on the image to enlarge it and you will be show a screen similar to that shown below.
To see a detailed view of what your map will actually show when printed, click the Plus sign in the top left of the map to zoom in further and see the actual detail as shown below.
You can also slide the map around by clicking on it and dragging with your mouse. Please remember that map images cannot be copied, printed or reproduced in any form and are purely for preview purposes only.
Once you are happy with the map, you can now click the Add To Basket button and complete your order. Your map will then be professionally printed and sent to you. Delivery is usually 5 working days but please call if you have specific deadlines you need to meet.
If you do need any help, just give us a call on 0844 808 2495 or send us a message >
]]>You can perform a quick search in Excel by hitting CTRL > F and entering a Postcode which will find the row you want, but then the information is displayed in columns across the page making it difficult to read.
So this short tutorial shows how you can find a Postcode using Excel's built-in data form which also makes reading the information associated with the Postcode much easier.
Unfortunately the Data Form in Excel is usually hidden and you have to add it to your Quick Access Toolbar before you can use it. The following steps will show you how to do this but once it is done, the Data Form will be available whenever you use Excel in future.
Click the little arrow at the top of Excel which is called Customise Quick Access Toolbar and click More Commands.
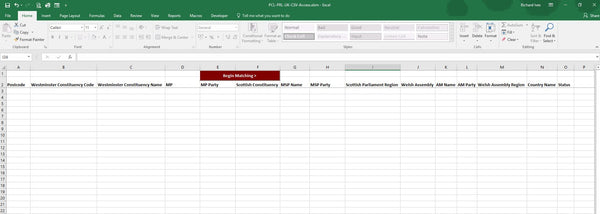
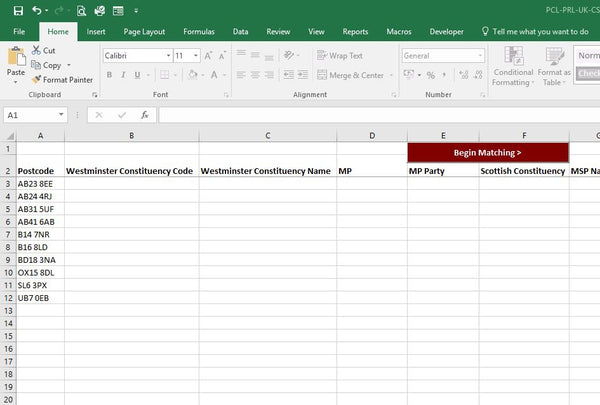
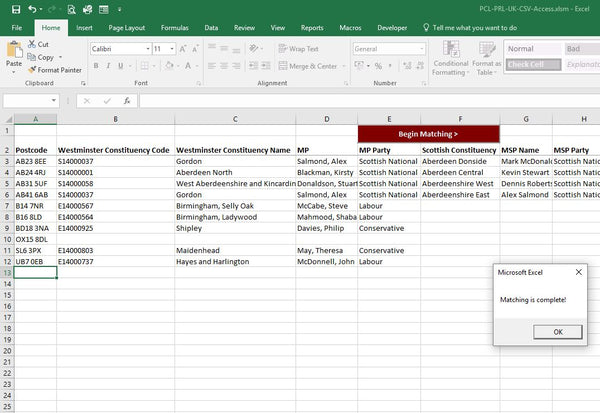
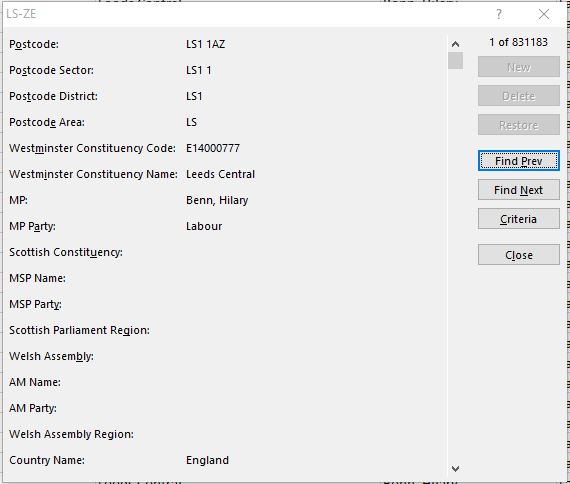
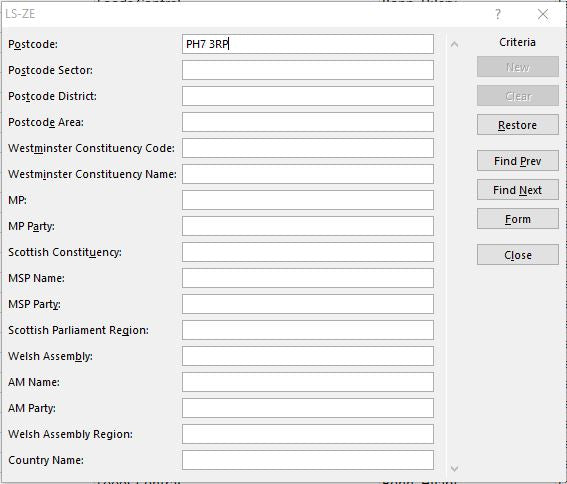
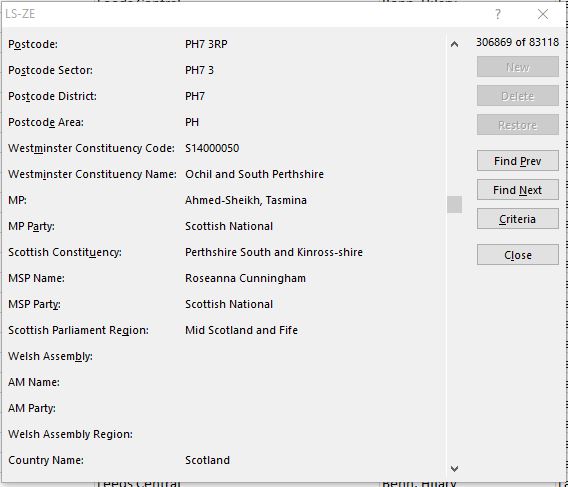
When you click More Comments, you will see the dialogue box below:
Click the left hand drop down list under Choose commands from and select the option highlighted in the image above: Commands Not in the Ribbon. The list box will then change to that shown below.
In the list to the left, find and click on the item call Form and then click the Add button in the middle. The box on the right should then contain the Form item as shown below.
When you click OK in the bottom right of the dialogue, you will return to Excel and will see the Form button in your Quick Access Toolbar at the top as highlighted in the image below.
Your Form button is now ready to use and the next steps will show you how!
Now you have access to the Excel Data Form, the following steps show how to use it through illustration with our Postcode & Constituency Excel spreadsheet. In this spreadsheet we have all UK Postcodes and Parliamentary information spread across 3 work sheets (because each sheet is limited to approximately 1 million rows) as follows:
For our example, we want to find the Parliamentary information for Postcode PH7 3RP and as the form only works on a sheet (rather than the entire workbook) we need to click on the LS-ZE tab which contains all the Postcodes for the PH Postcode Area.
Once there, select any cell and then click your Form button in the Quick Access Toolbar to show the dialogue below.
Note that all the data elements are greyed out. This is because the spread sheet is protected by default to avoid accidental deletion or over-writing of the information it contains.
Click on the Criteria button to the right and you will see the dialogue below. Note that the data fields are now white allowing you to type into them. In the field for Postcode type PH7 3RP and hit Enter on your keyboard.
You will now see the form below displaying all the Parliamentary Constituency information associated with PH7 3RP in a nice and easy to read format.
We hope this quick introduction to the Excel Built-in Data Form proves to be useful but if you have any questions or suggestions we would love to hear from you.
]]>Buy online - choose from a range of superb Edinburgh Postcode Map options guaranteed to meet your specific requirements and budget from just £34.99, delivered to you door in 5 days.
This is a popular pre-printed Postcode map of Edinburgh city centre showing Postcode Sector boundaries covering from Davidson's Mains in the West to Portobello in the East and from the coast in the North to the University in the South. The map itself is a highly detailed Ordnance Survey street map showing key points of interest and street names. Prices for this large A0 map start at £34.99. Buy Now >
This Postcode map of the East Central Belt of Scotland covers the entire EH Postcode Area and beyond using an Ordnance Survey 1:150,000 scale colour map showing main roads, town and village names. It covers an area from Smethwick in the West to Bromford in the East and from Witton in the North to Sparkhill in the South. This map is also A0 in size and is available from just £34.99. Buy Now >
If the three maps above don't quite meet your requirement and you want a Postcode Map to cover a specific area of Edinburgh, then you can create your own custom made map using our online Maps Maker system.
With Maps Maker, you can tailor your Edinburgh Postcode map to your exact requirement. When you are happy, just place your order and we will despatch it straight to you. Maps Maker allows you to:
Get started by clicking here >
]]>
With the release of our latest UK Postcode Address File from Royal Mail, we have compiled and summarised the latest statistics for Postcodes and addresses in the UK. This information is up to date as at February 2015.
In summary there have been 5,356 Postcode changes and 119,698 delivery point changes since the previous update underlining the importance of keeping Postcode and address databases up to date with the latest Royal Mail information.
Type | Number |
Number of Postcode Areas (e.g. OX) |
124 (Unlikely to change) |
Number of Postcode Districts (e.g. OX7) |
2,985 |
Number of Postcode Sectors (e.g. OX7 5) |
11,185 |
Number of Small User Postcodes (e.g. OX7 5LJ) |
1,626,776 |
Number of Large User Postcodes |
118,788 |
Number of Large User Postcodes with PO Box |
59,821 |
Total Number of Postcodes |
1,745,564 |
Number of actual Delivery Points (Does not include a count of multi-occupancies) |
29,506,194 |
|
|
Small User Postcodes Added |
1,709 |
Large User Postcodes Added |
1,245 |
Small User Postcodes Banked |
450 |
Large User Postcodes Deleted |
1,952 |
|
|
Delivery Points Added |
57,762 |
Delivery Points Amended |
16,250 |
Delivery Points Deleted |
45,686 |
"Postcode Area" means the outward part of the Postcode made up of the first one or two alphabetic text only characters. For example, 'OX' from OX7 5LJ and 'B' from B1 3ND.
"Postcode District" means the outward part of the Postcode. For example, 'OX7' from OX7 5LJ and 'B1' from B1 3ND.
"Postcode Sector" means the outward part of the Postcode plus the first numeric digit from the inward part of the Postcode. For example, 'OX7 5' from OX7 5LJ and 'B1 3' from B1 3ND.
"Postcode" means the full Postcode. For example OX7 5LJ and B1 3ND
"Small User Postcode" is a Postcode containing a collection of (usually) adjacent addresses. A single small user postcode may contain up to 100 addresses, but 15 is a more typical number.
"Large User Postcode" are allocated to single addresses receiving at least 500 mail items per day (e.g. business addresses).
"PO Box" is a numbered box in a Post Office assigned to a person or organization, where letters for them are kept until called for.
"Delivery Point" is a complete postal address (business or residential), including a Postcode. to which mail is delivered.
]]>Ever wondered how or why postcodes started? The following tale provides an overview of why and when the Postcode system was introduced.
In the mid-19th century, central London postal districts were divided between East Central (EC) and West Central (WC); whilst the perimeter of inner London was split into N, NW, NE, S, SW, SE, W, and E. This first system of ten London postal districts was devised by Sir Rowland Hill and introduced in 1857 and 1858. S and NE were later dropped and are now used for Sheffield and Newcastle. The numbered subdivisions (W1, W2 etc) were a war-time measure and date from 1917. The 1917 subdivisions remain important, because they form the first part of the two-part modern postcode (so N1 1AA is an address in the old N1 district), and because they continue to be used by Londoners to refer to their districts.
In the late 1950's, the Post Office experimented with electromechanical sorting machines. These devices would present an envelope to an operator, who would press a button indicating which bin to sort the letter into. Postcodes were suggested to increase the efficiency of this process, by removing the need for the sorter to remember the correct sorting for as many places.
In January 1959 the Post Office analysed the results of a survey on public attitudes towards the use of postal codes. The next step would be choosing a town in which to experiment with coded addresses. The envisaged format was to be a six character alphanumeric code with three letters designating the geographical area and three numbers to identify the individual address. On 28 July Ernest Marples, the Postmaster General, announced that Norwich had been selected, and that each of the 150,000 private and business addresses would receive a code by October. Norwich had been selected as it already had eight automatic mail sorting machines in use.
When this modern postcode system was introduced for London in 1960s, the numerals were added such that the areas nearest central London were allocated the number 1 (W1, SW1, etc.). Afterwards, numbers were allocated alphabetically, not by geography, and with complete disregard to the boundaries of London’s boroughs.
In October 1965 it was confirmed that postal coding was to be extended to the rest of the country in the "next few years". On 1 May 1967 post codes were introduced in Croydon. The codes for central Croydon started with the letters CRO, and those of the surrounding post towns with CR2, CR3 and CR4. This was to be the beginning of a ten year plan, costing an estimated £24 million. Within two years it was expected that coding would be used in Aberdeen, Belfast, Brighton, Bristol, Bromley, Cardiff, Coventry, Manchester, Newcastle upon Tyne, Newport, Reading, Sheffield, Southampton and the western district of London. By 1967 codes had been introduced to Aberdeen, Southampton, Brighton and Derby. In 1970 codes were introduced to the Western and North West London areas. In December 1970 Christmas mail was franked with the message "Remember to use the Postcode", although codes were only used to sort mail in a handful of sorting offices.
During 1971 occupants of addresses began to receive notification of their postcode. Asked in the House of Commons about the completion of the coding exercise, the Postmaster General, Sir John Eden stated it was expected to be completed during 1972.
The scheme was finalised in 1974 when Norwich was completely re-coded but the scheme tested in Croydon was sufficiently close to the final design for it to be retained. Newport was originally allocated NPT, in a similar way to Norwich and Croydon, with the surrounding towns allocated NP1-NP8. This lasted into the mid 1980s when for operational reasons it was recoded.
]]>The Postcode system is dynamic - it changes frequently with around 1.25 million address changes in an average year. There are times when Royal Mail are forced to make changes to the Postcode system in order to maintain postal delivery efficiency.
For example, new housing developments or business parks in already densely populated areas can leave no free postcodes for Royal Mail to allocate. this can lead to the recoding of a wider area to create additional codes to allocate.
Royal Mail are continually updating the national address database but they release Postcode update summaries every 6 months which provide broad details concerning which areas have been affected. See below for the latest Postcode release information.
Map-Logic provide updates to all associated databases and tables every 3 months to help ensure your data content is as accurate and up-to-date as possible.
The documents linked to below detail the latest Postcode changes and address statistics for reference.
This table shows the number of businesses and vacant organisations on the Royal Mail address database, the Postcode Address File (PAF®). The table compares the latest month's figures with those from the previous month, identifying the percentage variation between the months. > Download
This document shows the number of delivery point additions, deletions and changes and the reasons for the change.
> Download
This table shows the sectors and localities applied to the Postcode Address File (PAF®) system this month.
> Download
This table shows the total numbers of, and number of changes to, Postcodes, localities, Post Towns, delivery points and other PAF elements. > Download
]]>Map scale can be a tricky thing - it restricts the options for the amount of information you can have on a map and it can also be a little tricky to explain why! We get a lot of requests for maps that just won't work - including requests for single wall maps of the UK at street level - read on to find out how and why.
Modern map scales are usually represented as a ratio and the most common map scales displayed in this way are:
1:10,000 (large scale)
1:50,000
1:100,000
1:250,000
1:800,000
1:1,000,000 (small scale)
But what do these actually mean?
Very simply, and taking 1:50,000 as an example, 1 cm measured on the map will equal 50,000 cm in the real world. So if we measured the distance between two points on a 1:50,000 scale map as 40 cm then the actual distance in the real world would be 2,000,000 cm or 12.427 miles.
By comparison, on a 1:800,000 scale map, 40 cm would be the equivalent of 198.839 miles.
1:800,000
1:150,000
1:15,000
For the above reason, it become clearer why our local Postcode Sector maps are at a scale of 1:150,000 scale but the national map is at 1:800,000 scale - the national map covers a much larger area than the Postcode Sector maps and therefore we have to squeeze more miles into each centimetre on the map.
So what about that street level map covering the UK? What is the problem?
First we have to consider the amount of detail you need to be able to display streets, with their names, on a wall map. To do this properly on any piece of paper without making the streets blur together or making the street names illegible means that you can only squeeze about 1/10th of a mile into each cm on the map. Try and squeeze more in and the street detail is lost.
So, working from here, if you were to have a UK map at street level when you can only squeeze 1/10th of a mile into each cm then the wall map you would need would need to be approximately 60 metres high and 36 metres wide. You'd need a pretty big wall to mount the map on!
If you really do need street level detail for your business (or leisure activities) then consider the following options:
1. Do you really need all the UK covered or is it just certain target areas such as major cities? Whilst this would require multiple maps it is technically possible and may prove to be economically viable.
2. Can you make do with a national map and PC based street maps for reference? For example, a national wall map for reference purposes but then one of the ever-improving PC map systems such as Multimap, Google Maps or Google Earth which you can use off line.
3. Does your requirement justify investment of more specialist mapping software? These systems can cost from a few hundred pounds to many thousands and selecting the right one for you can be tricky but they are highly customisable and can be extremely powerful.
Whatever your requirement, if you are stuck or need advice then just let us know - we'll be glad to offer our assistance.
]]>Mapping software has been around for a many years but the internet has really brought computerised maps into daily use over the past 20 years.
The problem with 'mapping software' is that the price you pay generally depends upon two key factors:
1. The software itself and what it is capable of; and
2. The data used in the maps. The amount of data you need and the more detailed and more up to date it is - the more expensive it is. (However Ordnance Survey have recently released a lot of their data for free which has chnaged this for the better)
To make life simple, this article categorises mapping software into 3 broad 'camps' which are described below along with an overview of which solutions are best for various requirements. If you are not sure which solution is best for you and you want some free advice then just use the brief us form to let us know what you want to do and we will offer you impartial advice on the best solution.
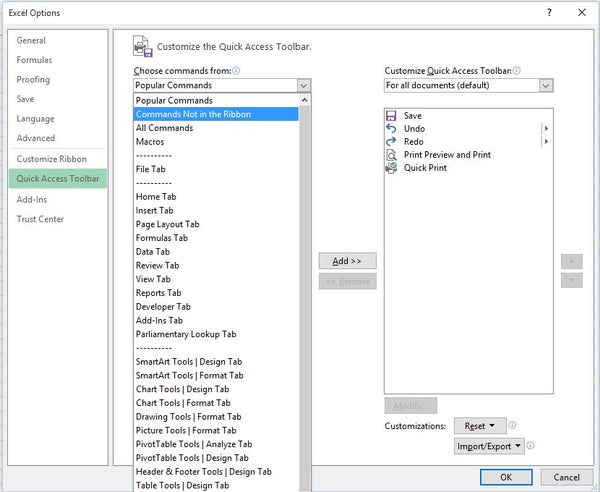
Free computer maps are generally limited to internet-based solutions and, in the UK, the main providers of free mapping sites are Google, Microsoft Live Maps and Multimap.
In addition to these, you can download Google Earth for free and play for hours exploring the world.
All of these systems provide a detailed level of information (streets) for the UK and allow simple navigation tools to find a location of interest. Most also allow you to measure distances, add points of interest or calculate routes between locations.
These systems are ideal for visualising simple data geographically as general reference tools or for planning routes.
For many businesses, maps play an important strategic and operational role and the free map systems described above don't offer the right information or provide enough functionality to do what they need. For example many businesses rely on maps to:
1. Target mailing campaigns to consumer demographics,
2. Create, optimise and manage sales territories
3. Create and communicate franchise areas
3. Analyse customer concentrations across a region and so on.
These types of applications require additional data (such demographic information or postcode data) and additional functionality in the software.
At the moment there is really only one choice in this area of entry-level business mapping software at a reasonable price which is Microsoft MapPoint. Previous versions have had mixed reviews but, for a mapping system costing less than £400 it is a good option and hopefully the new version has ironed out any previous problems.
These systems are ideal for undertaking common business analysis and planning functions such as creating sales territories, mapping your own customer or sales data, mapping population demographics and so on.
At the top of the mapping software in terms of power and sophistication range are the Geographic Information Systems. Before the internet and the likes of Google and Microsoft got involved - these were the only providers of PC based mapping software.
These systems are essentially completely customisable. You can choose the features you want and the data you need to be included in your system but, as a result, they are not cheap. A basic system from a supplier such as Pitney Bowes MapInfo or ESRI is likely to cost you in the region of £5,000+ and the chances are there will be annual renewal fees for the software and data as well. And this is just to use the system on one PC!
But what these systems don't do isn't worth knowing about. Optimisation techniques, 3D visualisation, cartographic manipulation and so on - these systems are not for the faint-hearted and generally require training and support services to help you get the most our of your investment.
Such systems are used in areas where they really do provide indispensible work and highly profitable returns. Examples are store location optimisation for large retailers; environmental risk assessment for insurance, sales territory management for FMCG companies. Where deployed correctly, these systems are certainly worth their weight in gold...
]]>The Postcode Address File from Royal Mail is the essential database of UK addresses.
PAF® can provide significant costs savings to any business by reducing the amount of time taken to capture customer addresses either over the phone or via your website. Additional benefits of streamlined address entry are increased customer satisfaction and reduced web purchase abandonments.
As the only complete source of UK addresses and Postcodes, PAF® also ensures you get the address right first time – essential for correct mail delivery and protecting your business’ professional image to aid customer retention. Correcting address spelling mistakes and formatting errors can also be very time consuming and costly if attempted after the event.
PAF® also helps you sort your mail with a full list of correct Postcodes, helping to reduce your postage costs with various Royal Mail services such as Mailsort®, Presstream® and Cleanmail®. Postage costs can further be reduced by improving or removing poor quality addresses by comparison to the national address database.
Whatever the nature of your business, whether you despatch products to your customers or communicate with them via direct mail, you need PAF® to do it efficiently and professionally.
The latest update of PAF incorporates over 50,000 changes to delivery points (addresses) and over 3,000 Postcode changes including nearly 2,000 new Postcodes and over 1,000 Large user Postcodes deleted. As Large user Postcodes are predominantly used by businesses receiving high volumes of mail we wonder whether the reduction of large user Postcodes is a sign of the struggling economy?
For more information on PAF please visit our Postcode Address File product page.
]]>For a system which was designed purely to simplify the delivery of mail to any property in the UK, the postcode has become an essential tool in the operations of almost every business in the UK. This article looks at some of the more common and powerful applications of the Postcode in businesses of all sizes.
There are approximately 1.7 million Postcodes covering the United Kingdom - a mix of large user Postcodes for businesses who receive large quantities of mail, non-residential Postcodes for small businesses and residential Postcodes which are shared, on average, by around 15 residential properties - usually a street.
One important feature of the Postcode system for businesses is that it is hierarchical - Postcodes are geographically grouped into Postcode Sectors (e.g. all Postcodes beginning with UB7 0 are grouped together) which in turn are grouped into Postcode Districts and these are grouped into the 124 Postcode Areas (e.g. UB). This makes it a perfect framework for covering the UK from a national level to a local street level.
To find out more about the Postcode read the related articles on the History of the Postcode and the Postcode Structure.
One of the simplest uses of the Postcode is to find out where a business or residential customer is! Punch a Postcode into Google maps and you will see - reasonably accurately - where your customer is. In general the Postcode will take you to the correct street and from there you should be able to find the house number.
This ability to locate customers, prospects or suppliers has been extended using software systems that can then take a number of locations and plan the most efficient (quickest and most cost-effective) route to create a sales persons call plan or a logistics delivery route.
Locating addresses in this way is also used to allocate customers and prospects to field sales teams where sales territories and areas are defined by Postcode (see below). For example, if you receive an enquiry from a customer whose location is in LS26 3PX then you can easily allocate that prospect to your sales person who is responsible for the LS26 Postcode District.
This is one of the most common applications for Postcode wall maps and AlignMix Territory Mapping Software.
The most common way of defining field sales areas is also through the use of the Postcode system.
Postcode Sector or District maps are generally the most popular maps for this purpose as they offer a a contiguous and complete coverage of the United Kingdom and can be allocated to named sales people based on the persons home location.
But using the Postcode can also make it easier to ensure that your sales people have the same workload or sales opportunities.
Using your customers Postcodes, you can run some analysis to determine the number of customers in each Postcode District and then allocate Districts to your sales people, adding up the customers as you go, until your sales people have an equal number of customers to visit.
This approach can help reduce one of the biggest causes of conflict in a field sales force - who has the most sales (and therefore commission) potential.
Franchise businesses have boomed over the past 30 years allowing people to have the opportunity of being their own boss with the security of the backing of a large successful business. Most franchises plan their network using the Postcode to ensure that franchisees do not encroach on other franchise areas.
In many cases, a Postcode District based franchise map (which illustrates for each franchisee the area they are allowed to trade in and market to) is provided as an appendix to the franchise contract.
Franchises can benefit from wall maps of their franchise areas to clearly visualise franchise territories and also from software to help analyse, plan and create the optimum franchise structure.
Most businesses rely on Postcode information in some way, so if you have a need to analyse, map or plan using Postcodes then just give us a call or send us a message and we'll be glad to help.
]]>The UK is broken down into 124 Postcode Areas - the first 1 or 2 letters of the Postcode. For our office Postcode of UB7 0EB, the Postcode Area is UB (Uxbridge). Areas may also have a single character such as B for Birmingham or M for Manchester.
Whilst the population of each Postcode Area varies wildly from just 23,167 in ZE (Lerwick) to over 1.9 million in B (Birmingham) alone! But as an approximation, the average population in a Postcode Area across the United Kingdom is 510,000.
Each Postcode Area is then broken down into Postcode Districts which is the part of the Postcode before the space - also known as the Outward Code. Again for our office Postcode UB7 0EB, the District would be UB7 but the District can also have two digits such as L12 or SL18.
There are approximately 3,000 Postcode Districts covering the UK, each containing an average of just over 20,000 resident people.
The Districts are then further broken down into Postcode Sectors which is the District plus the first number after the space. Our office falls within the Postcode Sector UB7 0.
There are over 11,000 Postcode Sectors covering the UK - on average 4 Sectors to a District and 90 Sectors to each Area. Each Postcode Sector contains a little over 5,500 people.
Each Sector then contains the individual Full - or Unit - Postcodes. For example, the Postcode Sector UB7 0 contains all Postcodes that begin with UB7 0 - including our own office Postcode UB7 0EB. There are over 1.7 million Postcodes currently in circulation across the UK and each one contains on average 16 households and 36 people.
]]>