0 Cart
Added to Cart
    You have items in your cart
    You have 1 item in your cart
    Total
    Check Out Continue Shopping

    Articles

    Analysing Average House Prices by Postcode
    Analysing Average House Prices by Postcode

    Average House Prices by Postcode

    House prices are always in the news. Whether there is a property market crash, a downturn in the economy or a debate about housing stock; average house prices are often used as a barometer of the current state of the economy - even if this can be misleading!

    For businesses looking to market products to a defined audience or target sales activity to the most profitable areas, house prices can play an important part in refining that strategy.

    A Measure Of Household Wealth

    Houses are the largest component of wealth for the majority of households in the United Kingdom.

    And it goes without saying that, in general, the larger and more expensive the property, the higher the household income required to make the mortgage or rental payments.

    Of course care should be taken to equate house price to disposable income. The income of many households is now stretched and a higher percentage of income than ever before is being used to fund the mortgage or rental payments on property.

    All Properties Are Not Equal!

    Of course, there are huge price fluctuations across the country and the average price of a similar type of house in different parts of the country can vary wildly.

    As we all know, detached properties are more expensive than terraced and properties in the North of England are more expensive than the South East.

    As an example, according to the Land Registry data for Q2 2016, a detached house near Preston in Lancashire will, on average, cost around £270,000. Purchase a similar detached house near Harpenden in Hertfordshire and it will set you back in excess of £1 million!

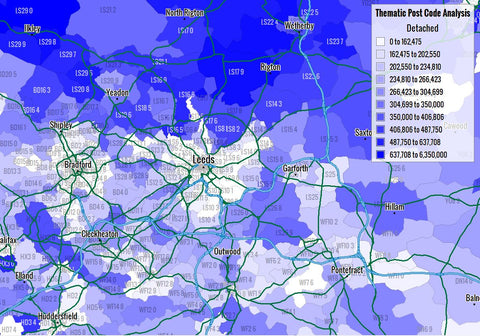
    Average detached house prices across Leeds by Postcode Sector

    Fig 1: Average detached house prices across Leeds by Postcode Sector

    But variations in prices are not just national or regional in nature.

    The image above shows Postcode Sectors shaded by the average prices for detached properties for 2016 Q2 - the darker the blue, the higher the average price as indicated in the key, top right of the image.

    Detached prices in the dark blue areas north of Leeds indicate averages up to £650,000+ whereas the areas to the South of Leeds are much lighter indicating typical prices much lower at around the £200 - £350k range.

    Such differences can affect decisions such as where to promote high value luxury goods.

    Identifying Product Demand

    Understanding the local property markets can also help identify the demand for specific products and services.

    For example, areas with high volumes of property transactions are more likely to have households looking for high value products such as white goods, furniture and carpets with which to furnish their new homes.

    Equally, areas which have seen dramatic price increases in house value are likely to have homeowners more inclined to free up equity to purchase a new conservatory or extension.

    Key Statistics

    In analysing the average house prices for Q2 2016, we thought it would be fun to see which Postcode Districts topped the charts!

    These figures only reflect sales made in Q2 2016 where at least one transaction took place.

    Highest House Prices

    Type

    Postcode District

    Average Price (£)

    Detached

    SW13

    £5,000,000

    Semi-Detached NW1 £11,500,000
    Terraced WC1N £6,750,000
    Flat W1G £3,815,000
    Overall Average W1G £3,815,000


    Lowest House Prices

    Type

    Postcode District

    Average Price (£)

    Detached

    CF40

    £75,667

    Semi-Detached LL71 £45,000
    Terraced TS2 £30,000
    Flat BB6 £19,000
    Overall Average TS2 £30,000


    Licensing the Data

    If you are a business interested in licensing the average house price data for England and Wales, you can find out more information on our Average House Price by Postcode product page.

    5 Tips For Creating Great Sales Territories

    Building a sales or service territory structure from scratch can be a daunting task and mistakes can lead to intense frustration and lost time. So here are our 5 top tips to help you avoid the costly mistakes and help you build your ideal field sales or service territory structure quickly and efficiently.

    #1: Create The Territory Around The Business, Not Your Sales Staff

    Sales staff come and go: retirement, relocation or just career progression. So designing territories based on where your sales people live is not a great idea for long term sales force efficiency. Territories will need to be taken over by future staff who could live anywhere within the area.

    Create Territories For Your Business

    So sales territories need to be created around the long-term needs of your business such as servicing existing customers - or acquiring new ones - as quickly and as profitably as possible.

    Of course, there are always exceptions to the rule. Important clients may come with established relationships with their preferred sales staff —so much so that they won’t work with anyone else! In these situations, you may need to assign the preferred sales person to that account to ensure the customer is made to feel valued and their business retained.

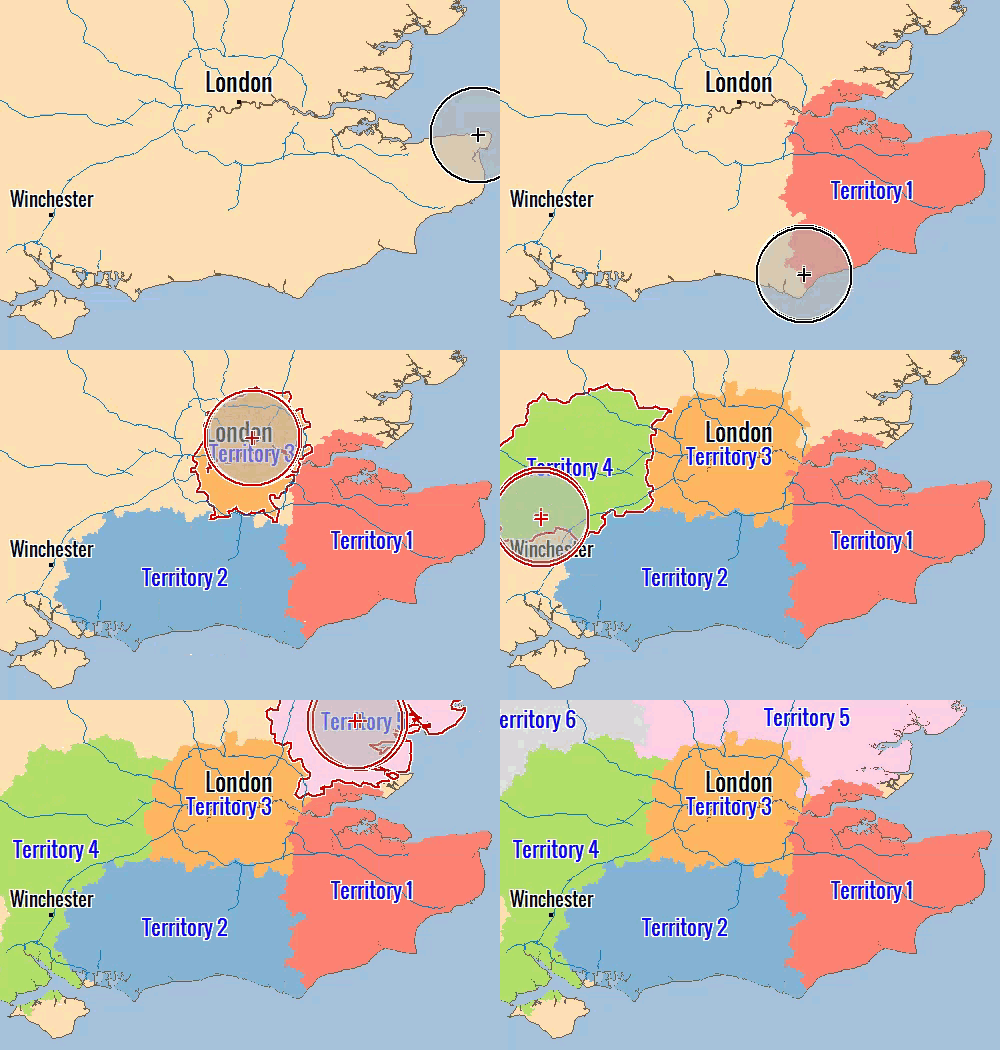
    #2: Start In The Corners And Work Your Way Inwards

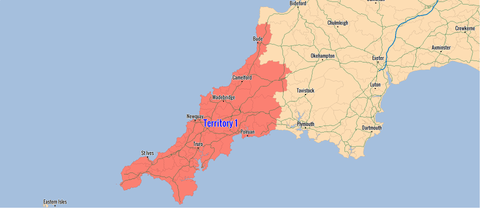
    When creating sales territories for the first time, it’s usually best to start in areas where options are limited like the corners of the map. In the UK, good places to create your first territories are Cornwall, Kent, South West Wales or Northern Scotland and then work your way inland.

    When you reach the interior of the country, you will have much more flexibility to reallocate Districts or Sectors and achieve the optimum balance of workload or sales potential across your territory structure.

    Build Territories From The Corners

    This approach will save countless hours of work, create the most equitable and balanced territories and ensure that each territory will have sufficient revenue potential to be viable.

    #3: Always Take Local Geography Into Consideration

    Understanding natural and man-made geography is extremely important when creating sales territories. Can you expect sales staff to reach their daily call quota if they need to cross the Highlands just to reach half their client list? Or worse, what if they need to cross the Irish Sea just to see some key accounts?

    This is why local geography always needs to be taken into consideration. Failing to do so will result in wasted sales time and frustrated staff, which inevitably leads to lower sales revenue and higher staff turnover.

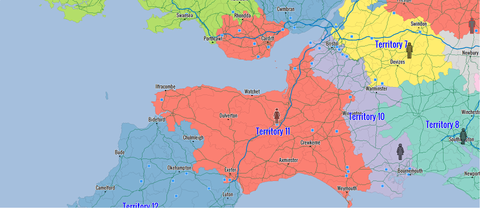
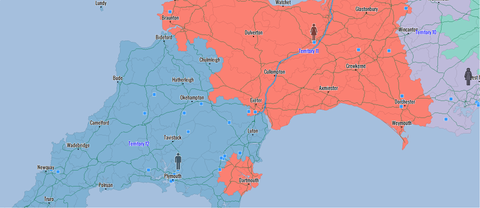
    In the example below, you can see an poorly crafted sales territory. The sales person in territory 11 (red) has to cover Devon but also drive up to cross the Severn Bridge to reach the accounts in Cardiff.

    Take Local Geography Into Account

    To optimize this sales territory, you would need to re‐allocate Cardiff accounts to the green and blue territories so that the sales person no longer has to cross the bridge to reach Wales.

    #4: Use Motorways As Territory Arteries Not Boundaries

    At first thought, it may seem logical to use major roads and motorways as territory borders as you can only cross them at motorway junctions or via bridges. However, motorways in particular are high speed routes to the extremities of territories – plus the safest roads to drive on!

    Using motorways as arteries allows sales people to reach their accounts faster and more efficiently resulting in more time in front of clients and less time in the car.

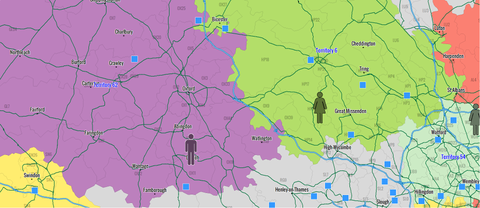
    This is illustrated in the example below. Here, you see two territories, 6 (green) and 22 (purple). Both sales staff have to use the M40 to reach their respective accounts in Bicester and, as a consequence, pass through each other’s territories on the way.

    Use Motorways as Territory Arteries

    This is not an efficient use of time and effort. Ideally, we should re‐allocate all the Bicester accounts to just one of the two territories and shift the territory boundary so that just one sales person has access to that section of the M40.

    #5: Eliminate Territory Islands

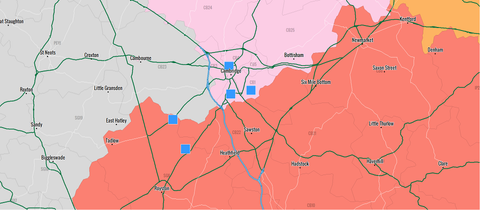
    One of the most inefficient territory characteristics is when a sales rep needs to cross someone else’s territory to reach a client! They will literally be driving by someone else’s accounts to reach their own which is clearly a drain on time and resources.

    It is not uncommon for sales people to request accounts in other territories because they may be located near their children’s schools or near family. Because they frequent the area all the time they will assume it’s only logical for them to have these accounts.

    Although this approach may make sense, you cannot take liberties like this for your sales staff. They will create long‐lasting business relationships and, at some point, they will leave the organization forcing a replacement to take over anyway.

    It is therefore always best to ensure all territories are contiguous.

    This is illustrated in the example below:

    Eliminate Noncontiguous Areas

    Here, the sales person in the red territory has to cross several Postcode Districts owned by the blue territory to reach the small cluster of red by Dartmouth.

    This is clearly not ideal and eliminating these non‐contiguous clusters will help optimize your sales territory structure.

    More Information

    For more information on how to build the optimum sales territory structure, call us today on 0844 808 2495 or download a free 2 week trial of AlignMix and have a play designing your own territories!

    Five Mapping Features All Franchise & Territory Managers Need

    AlignMix Territory Management Software

    With the launch of AlignMix in the UK, we look at five common mapping software features franchise and territory managers most often ask for.


    #1: Create Territories or Franchise Areas by ‘Painting’ the Map

    Creating territories or franchise areas from Postcode geography can be done in many different software mapping systems. But the process of grouping Postcodes to create territories differs in each system and can often be overly technical and time-consuming unless you are an expert user.

    Feedback from our customers indicated that creating territories should be as easy as using a simple paint program - just paint the areas on the map that you want to be included in each territory.

    AlignMix's patent pending Touch Align technology allows you to create an unlimited number of territories with literally a single click of your mouse! Simply click and move your mouse over the map and the underlying Postcode Districts are added to your territories as if you were painting them.

    Touch Align Sales Territory Creation

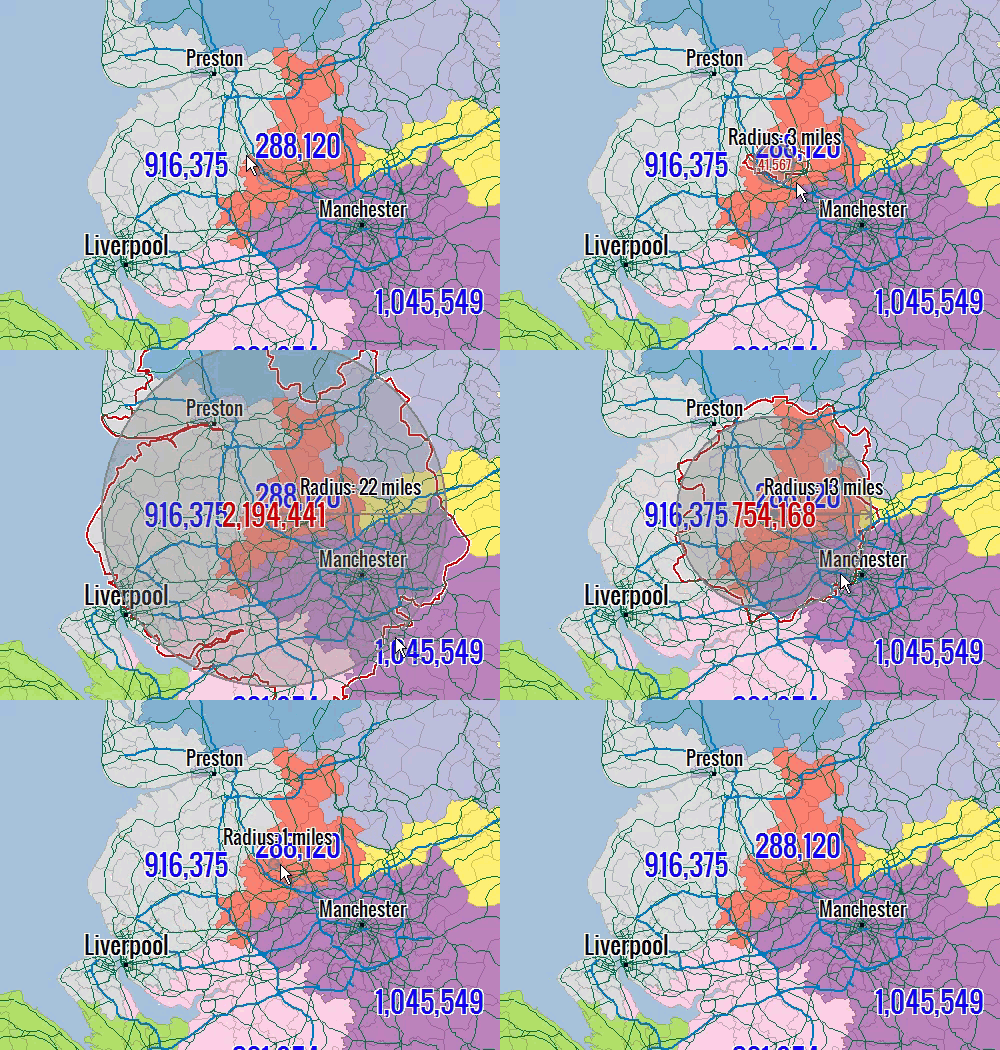
    Of course there are several other tools to create sales territories: the lasso tool selects a group of Postcode Districts to add to a new territory and the Circle tool selects all the Postcode Districts within your chosen radius of a given location.

     Circle Tool Franchise Area Creation


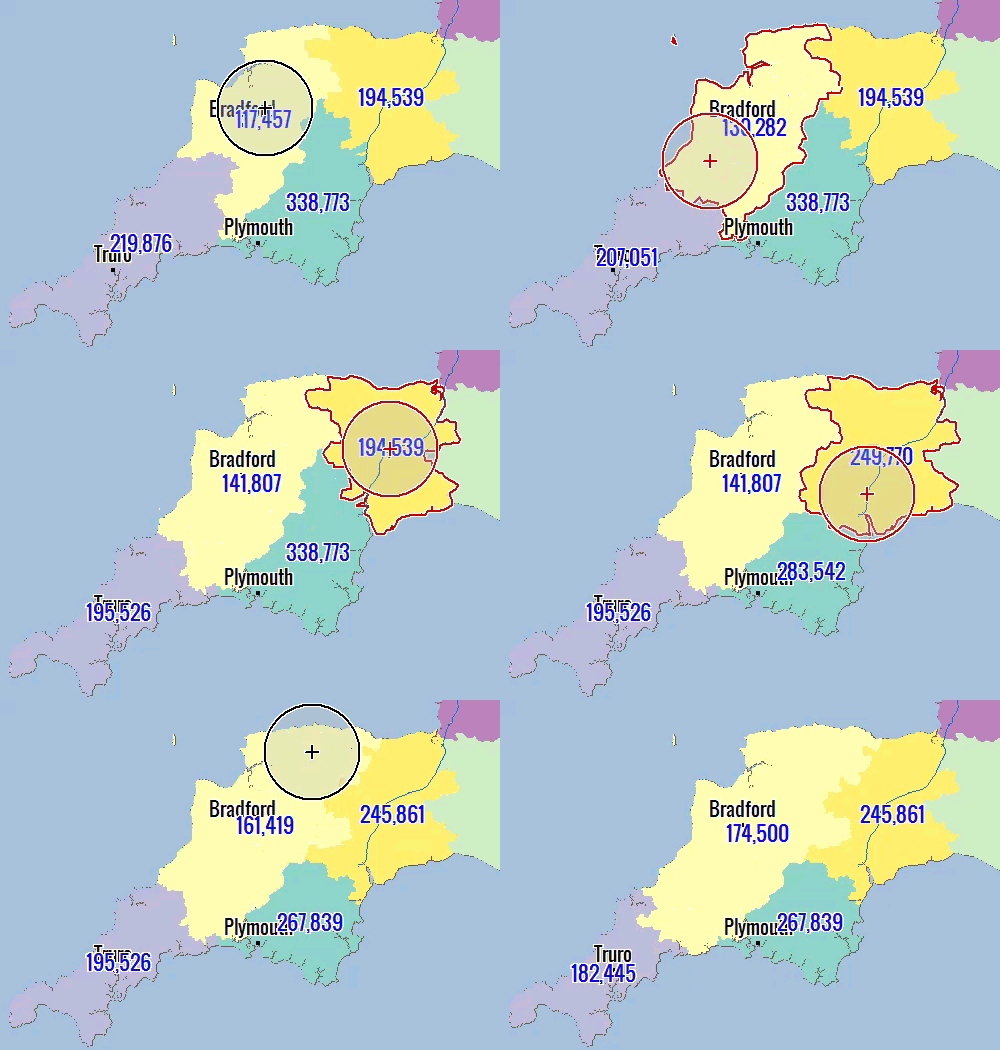
    #2: Show Changes to Territory Totals Instantly when Balancing and During Realignment

    When creating territories, you will usually want to ensure each sales person or franchise has an equal sales potential or workload if they are serving existing customers. One of the unavoidable task of territory management is reworking territory structures due to staff changes, changes in market demand or through expansion.

    AlignMix allows you to monitors a territory value when making these changes and show you the effects of any changes instantly on the map.

    You may want to monitor:

    • A demographic variable that defines your market such as one or more census counts
    • Your own customer sales figures or workload
    • A calculated Index using a combination of factors which can built directly in AlignMix

    Whatever you choose, you can see the impact territory changes have on the value in real time as you work. No need to run calculations after each change or refer to a separate spread sheet, AlignMix makes balancing territories effortless.

    Balancing Sales and Franchise Territories


    #3: Change Territory Colour Schemes Quickly and Easily.

     All software allows the colours of territories to be changed and some allow you to create your own colour sequences to save and use for future territories.

    AlignMix is actually supplied with a number of prepared colour schemes that you can apply to your territories at the click of a button.

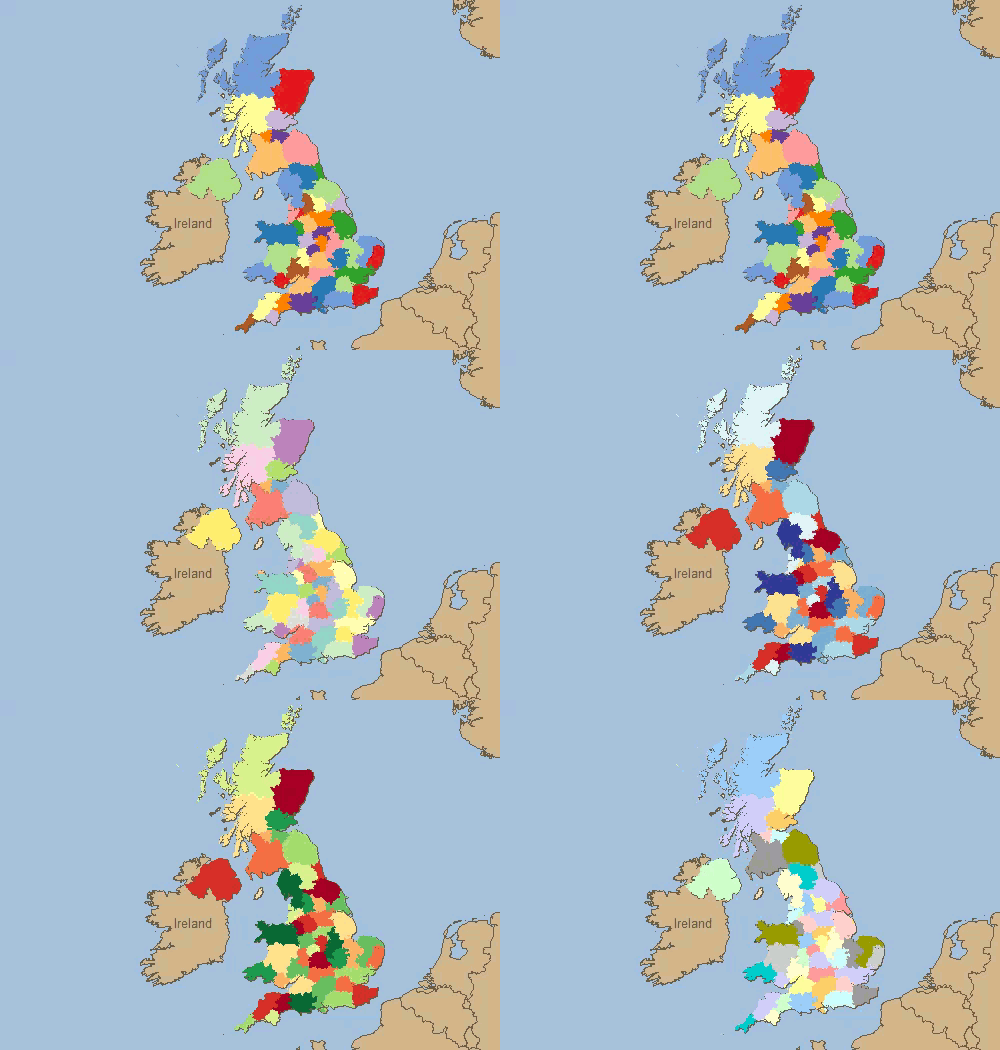
    Change territory colour schemes

    And if a standard colour scheme isn't quite what you are looking for you can use simply change the colour of any individual territory with a couple of clicks and select any colour you want.


    #4: Create Territory and Franchise Reports with the Push of a Button

    Once territories or franchise areas have been created, the next obvious step is to tell the appropriate staff or franchise owners what their area is and what it contains.

    Again, all this is possible in most types of mapping software but it many systems it can be a long, painful and frustrating process. You may have to undertake a number of steps to get what you want and a typical process might look like this:

    1. Navigate the map to the required territory
    2. Save the map as an image
    3. Export the list of Districts for that territory to a csv or Excel file
    4. Import your customers for the territories
    5. Run a calculation to identify the customers within each territory
    6. Export the customers for the required territory as a csv or Excel file
    7. Bundle the map and two lists as a pack for the territory
    8. Repeat the above for each territory you want

    Depending on the number of territories you have this can almost be a job in its own right!

    AlignMix Professional comes with the ability to produce territory spread sheets containing all the above information for every territory you have in an automated 'batch' process. Just leave it to run and send out the spreadsheets when the process is finished freeing up your time to do more important tasks.

    Download an example Territory Spread Sheet by clicking the Excel logo below.

    Territory Excel Spread Sheet


     #5: Make Thematic Maps of Sales Potential Simple to Create

    When planning and designing sales territories or franchise areas, it helps to know where your potential market is located.

    Sometimes importing demographic or sales data, defining your data ranges and setting the colour ranges can be quite a long winded process.

    Again, AlignMix Professional attempts to make this as simple and as intuitive so you have more time for planning the business rather than making the maps!

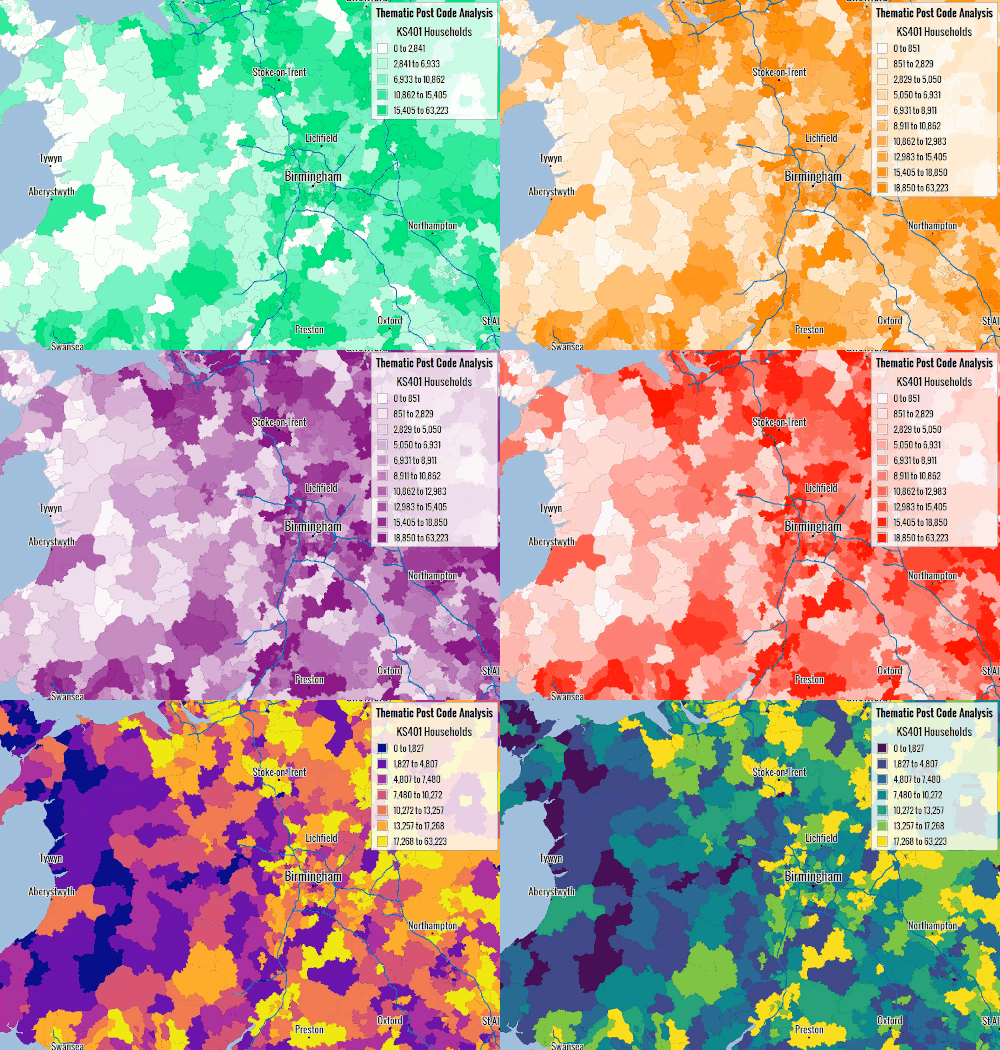
    Thematic Maps In AlignMix

    With a few clicks you can visualise your sales potential or existing demand to help with the designing of your sales territories or franchise areas.

    You can also add your territory boundaries and names quickly and easily to the map and see where market concentrations are within your territories.


    FIND OUT MORE

    Read more about the features of AlignMix and read our customer testimonials here >

    Download your FREE copy of AlignMix Standard and start mapping your territories today!

    How To Match Parliamentary Constituency Information To Postcodes

    How To Match Parliamentary Constituency Information To Postcodes

    Matching Postcodes and Parliamentary Information

    The relationship between Postcodes and Constituency information is vital for many businesses in building relationships with local communities based on their organisations political footprint.

    Identifying the constituencies that employees, suppliers and customers reside in is essential for targeting localised public relations activity and communication efforts to the key geographic areas for your business..

    Linking Constituency Information To Your Own Postcode List

    It is of course possible to look up Postcodes one by one and record the constituency, MP and political party for that Postcode. However, if you have hundreds or even thousands of Postcodes, manually collecting the information is clearly not practical.

    However, if you use Microsoft Excel there is a way of doing all the work automatically at the push of a button! Watch a video overview here:

    The Excel Postcode Lookup Spread Sheet

    We maintain a database of over 2.5 million Postcodes (including retired Postcodes) and the Parliamentary Constituency information related to each one.

    As Postcode and constituency data changes on a continual basis, we update all information every 3 months to ensure the spread sheet is as up to date as possible. 

    How Does It Work?

    To use this unique tool, we simply supply you with an Excel spread sheet and Access database for you to copy to a folder on your PC - no installation or technical knowledge is required (Note: you do not need to know how to use Access!).

    All you need is a current version of Microsoft Office and the ability to run macro's in Excel. It’s as simple as that!

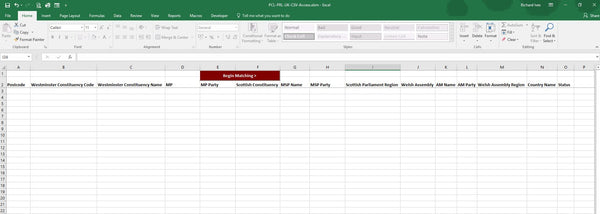
    To get started, simply open the supplied spread sheet as shown below: 

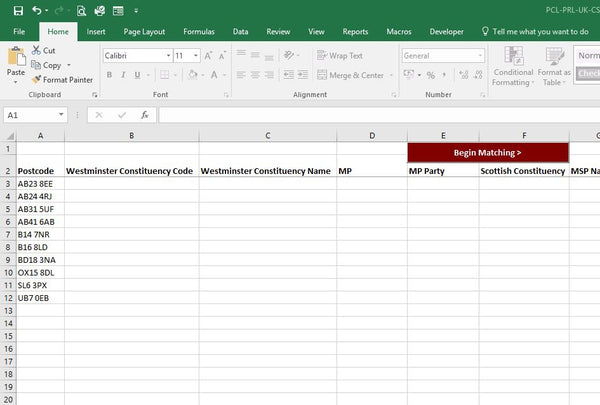
    Postcode Matching Excel Spread Sheet

    To start matching follow these simple steps.

    1. Type or paste a list of Postcodes in column A beneath the 'Postcode' header as shown below.
      Postcode List in Excel
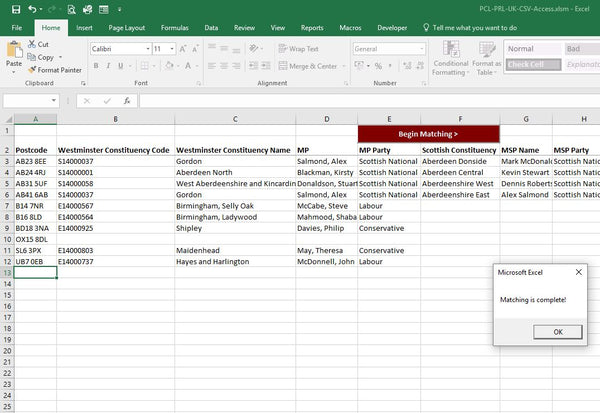
    2. Now simply click the ‘Begin Matching’ button at the top of the sheet and the columns will be populated with the relevant parliamentary constituency information automatically.
      Postcodes matched to parliamentary constituencies

    You can download the full User Guide for this Excel Spread Sheet here >

    Matching Speed

    Tests to date have shown that the spread sheet will match up to 1,000 Postcodes per minute. So for a handful of Postcodes matching is almost instant. If you need to run a large batch process then it may take a few minutes and it may be a good time to make a cup of tea!

    Postcode & Parliamentary Updates

    We update the Postcode database on a quarterly basis to take into account Postcode changes from Royal Mail and also changes to Constituency data as result of by-elections and other events.

    Licence Fees

    The spread sheet and supporting data is available for an annual licence fee of £595 plus VAT which includes all updates released during the year and unlimited support.

    The spread sheet can be ordered for immediate download directly from our Postcode to Constituency Excel Matching Spread Sheet page here >

    For more information on this Automated Excel Matching Spread Sheet, please use the contact form or call 0844 808 2495.

    Franchise Territory Mapping With Postcode Maps

    Postcodes are the most frequently used method for creating franchise territory maps across the UK. and therefore large Postcode wall maps have become an indispensable tool for visualising franchise territory coverage and planning local sales and marketing activity.

    Quality Franchise Postcode Maps

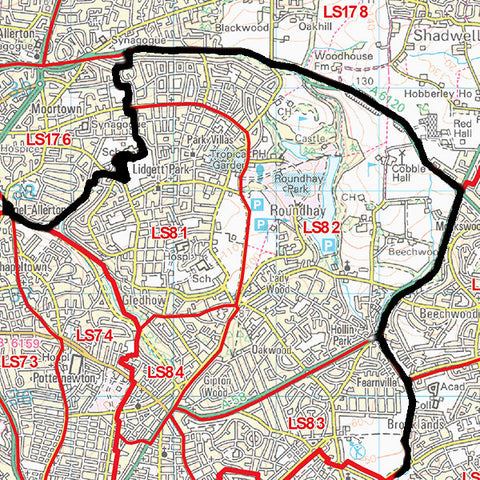
    Franchise Territory Mapping with Postcodes

    Map Logic Postcode maps are perfect franchise territory planning aids and provide the essential features required by successful franchise organisations:

    • Large A0 (119cm x 84cm) wall maps for easy viewing across the office.
    • Accurate Postcode boundaries from the latest official Royal Mail Postcode information.
    • Clear mapping from Ordnance Survey - the National Mapping Agency of Great Britain.
    • Long lasting and durable encapsulation (plastic coating) to maximise the life of your map.
    • No-quibble 14 day money back guarantee if you are not completely satisfied with your purchase.

    You can see which of our ready-made maps cover your franchise area by entering your town in the box below and clicking Go:

    Find available maps for the town of:

    Customise Your Franchise Territory Map

    Personalised Franchise Postcode Territory Maps

    Because all franchise businesses are different, we also offer a highly flexible customised map service to create the perfect map for your franchise. Used by banks, charities, automotive dealerships, gyms and even weight loss franchises, these maps offer:

    • Various sizes from A4 to 2A0 (168cm x 119cm)
    • Customisation to cover your specific geographic area and the Postcodes covered by your franchise.
    • The ability to add your franchise territory border to the map
    • Full personalisation with your franchise name as the map title!

    You can have a look at our custom map options online! Simply enter your town name in one of the search boxes below to get started:

    Create a Postcode District (e.g. OX7) map for the town of:

    Too Many Options?

    Not sure which option is right for you? Just let us know what you need and we will come back with the best options for you to consider.