EU Referendum Maps
As we have recently added EU referendum results to both our Postcode to Local Authority and Postcode to Parliamentary Constituency lookup products, we thought it would be interesting to produce a couple of simple GB maps to compare how the results looked at Local Authority and Parliamentary Constituency level.
Northern Ireland was not included in the maps as actual results were published for the Constituencies in Northern Ireland.
Brexit Vote Maps
We first produced two maps to simply illustrate if areas voted Leave or Remain, The first is the actual result by Local Authority where red is Remain and blue is Leave,
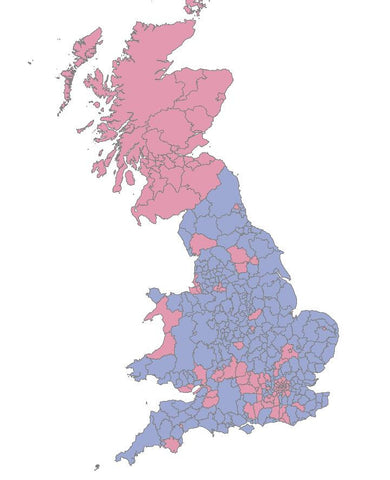
Brexit Vote map by Local Authority
The second map is the Brexit vote by Parliamentary Constituency. As results were not published at constituency level, many of these figures are estimates - you can read more about the estimated EU referendum results by Parliamentary Constituency here >
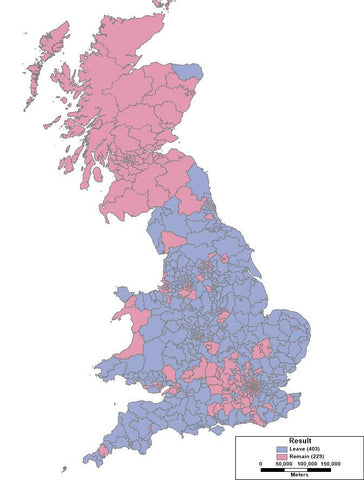
Brexit Vote map by Parliamentary Constituency
The first thing to note is that there are 650 Parliamentary Constituencies and only 380 Local Authorities and therefore there is much more granularity in the constituency map.
Aside from that, the patterns are very similar with Scotland, South Central, London and smaller pockets voting Remain but more rural areas of England voting Leave.
EU Referendum Vote % Maps
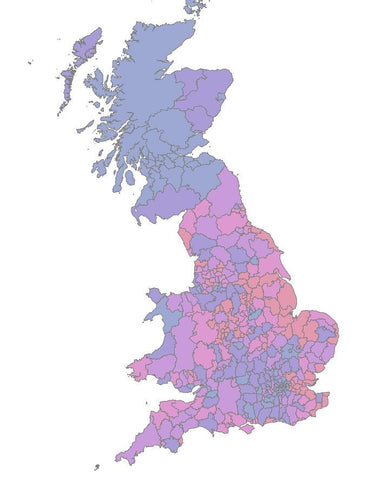
We also created a map showing the % vote to Leave by both Local Authority and Parliamentary Constituency. In these maps areas are given a range of colours from Blue to Red. Blue areas have the lowest vote to Leave % (and therefore highest vote to Remain %) and the redder the area, the higher the vote to Leave %.
Again, % Vote to Leave by Local Authority is first.
Vote to Leave % map by Local Authority
And by Parliamentary Constituency.
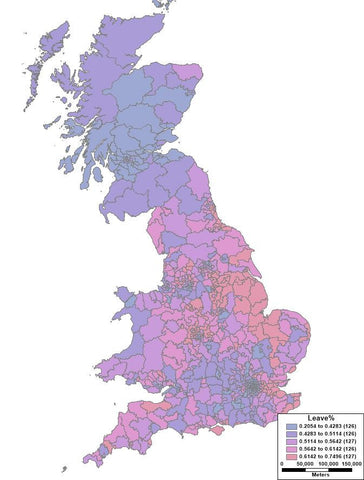
Vote to Leave % map by Parliamentary Constituency
Again, we can see subtle differences in the vote to leave % geographically but the general pattern shown by local authority and Parliamentary Constituency - as we would hope - remains the same.
The Underlying Data
If you are interested in the numbers behind the maps, you can download both spread sheets in Excel format for free.
EU Results by Local Authority >
EU Results by Parliamentary Constituency >
Copyrights & Sources
The source of the Referendum result figures by Parliamentary Constituency are as follows:
BBC – The BBC research. BBC, Local voting figures shed new light on EU referendum, 6 Feb 2017
DrCH – Dr Chris Hanretty. Chris Hanretty, Revised estimates of leave vote share in Westminster constituencies, 18 August 2016
Contains OS data © Crown copyright and database right (2017)
OS OpenData is free to use under the Open Government Licence (OGL).